
Main Page
The Main Page is divided into the main graphics area on the left, the pages area on the right, and the toolbar along the top.
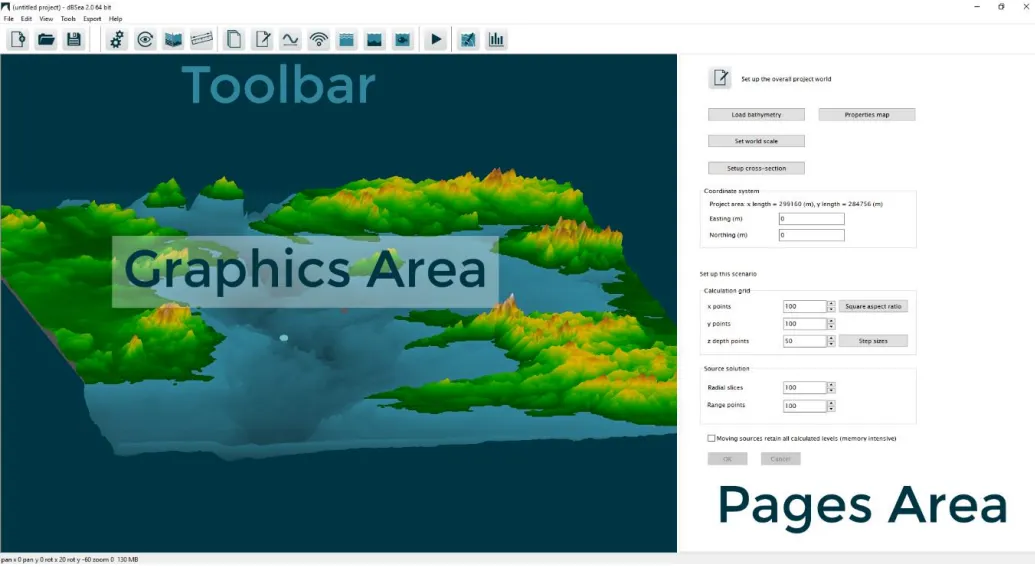 Image 1: Main screen overview of the dBSea interface.
Graphics Area
Section titled “Graphics Area”The main graphics area shows the current project environment, either in 3D view or cross-section. Noise sources, probe locations, and calculated sound levels are displayed over the project bathymetry. For more information on controlling the graphics display, see the page Controlling view and display.
OpenGL is used to display the graphics. dBSea v3 requires OpenGL 3.2 (core profile) or later. If you experience graphics problems, ensure your graphics drivers are up to date.
Pages Area
Section titled “Pages Area”Scenarios, sources, seabed, and other input properties of the current project are edited and controlled by the individual pages that show in the pages area. These pages are accessed via the buttons in the toolbar.
Toolbar
Section titled “Toolbar”The buttons in the toolbar control creating new projects, opening, saving, changing the view, accessing specific pages, and solving the current project. Hovering over each button displays the function of that button as tooltip text.
Main Menu
Section titled “Main Menu”The main menu opens from the menu button at the left end of the toolbar and has six sections: File, Edit, View, Tools, Export and Help.
File Menu
Section titled “File Menu”New, Open, Recent files, Save and Save as…, the licence items Import trial license file and Check for licenses (see Licensing), and Exit.
View Menu
Section titled “View Menu”The visibility of individual components (scale bar, water, bathymetry, sources, probes, sound level, sound level contours, grid) is controlled by checking or unchecking the items in this menu.
Cross-sections can be edited, saved, recalled, and named from this menu.
The ability to grab probes and sources can be toggled on or off in this
menu as well (Can select sources / Can select probes).
Tools Menu
Section titled “Tools Menu”- Load bathymetry - Import bathymetry from GeoTIFF, ESRI ASCII grid or CSV formats. See the page Importing bathymetry.
- Swap heights and depths - dBSea accepts input bathymetry with depths as positive numbers and land heights as negative numbers. Many GIS tools use the reverse definition, and if this is the case with imported bathymetry, this option will reverse the imported heights and depths.
- Source/probe array tool – A useful tool for creating large arrays. It allows you to copy a source or probe to create an array easily.
- Latitude/Longitude to Easting/Northing calculator – Can help you convert decimal degrees or DMS notation to UTM coordinates. The tool will use the UTM zone of the first coordinate set as the reference for the remaining coordinates.
- Remove calculated results from .uw3 file – In case you wish to strip the calculated levels from a saved file. This will greatly reduce the size of the saved file (but levels must be recalculated).
- New project with specified bathymetry depth – Generates a new, flat bathymetry of the given depth, with length and width of 10,000 m.
- CSV Editor - Opens the integrated CSV Editor, used to convert and edit bathymetry files from different formats. See the page CSV editor.
- View dBSea log – Lets you view the list of actions performed by dBSea, and export this. Useful for support queries.
- Python interface – Opens the Python scripting console.
- Preferences – Opens the Preferences window.
- Set API port / Start API – Shown only for licences that include the local API feature.
Export Menu
Section titled “Export Menu”- Export current scene as… - An image file containing the current scene, as BMP, JPG, PNG, PDF or GIF. If the current scene includes calculated sound levels, the exported image will include a scale bar showing the colour scale for levels.
- Export max levels, Export all levels, Export all levels including spectra, Export cross-section levels, Export cross-section levels including spectra - Calculated sound level data in text format. The delimiter defaults to a comma and can be changed under Preferences → Exporting. Data may be exported as the overall levels at each point, or the overall levels plus full spectra for each point. Copy visible levels as xy columns to clipboard copies the currently visible levels for pasting into a spreadsheet.
- Export levels with weightings - Batch export across several species weightings.
- Export bathymetry in ESRI Ascii grid format, Export bathymetry in .bth format (3MB / ESME) - The project bathymetry, for GIS packages or for the 3MB animat model.
- Export currently visible levels in ESRI Ascii grid format, Export currently visible levels in xyz format, Export levels as ESRI Ascii grid file series, Export contours as shapefile, Export contours as GeoJSON - Sound levels for import into GIS packages. When exporting ESRI ASCII levels, if the solution grid dx/dy aspect ratio is close to 1, dBSea will use the standard CELLSIZE parameter. If the aspect ratio is too high, then the non-standard DX and DY parameters will be used, which may not be fully supported by all GIS software. To use a square or close-to-square grid aspect ratio, use
Grid utilities → Set to square aspect ratioon the page Setup project. - Export exclusion zone in ESRI Ascii grid format, Export exclusion zone as shapefile, Export exclusion zone as GeoJSON.
- Animated results tool - Frame-by-frame animation of a moving source, saved as GIF or AVI.
See Results → Exporting Results for details of each export.
Help Menu
Section titled “Help Menu”Help opens the online documentation, dBSea assistant opens the AI assistant, and About, Release notes and Check for updates are self-explanatory. Licence status is shown under About.