Main Features
dBSea has been developed by acoustics professionals for acoustics professionals. The user friendly interface allows rapid modelling of problems including data import & export, input of noise sources, definition of propagation properties and exporting of results.
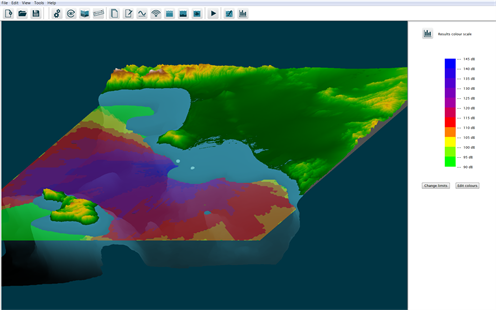
The model is represented in 3D and may be rotated and zoomed to allow easy navigation of the problem environment and examination of prediction results. Where previous analysis has been limited to individual calculation slices or transects, dBSea allows the entire problem environment to be modelled and analysed.
The 3D model is built by importing bathymetry data and placing noise sources in the environment. Each source can consist of equipment chosen from either the standard or user defined databases or recorded sound. Noise mitigation methods may also be included. The user has control over the seabed and water properties including speed of sound profile (how the speed of sound changes with water depth), temperature, salinity and current at any point in the scenario.
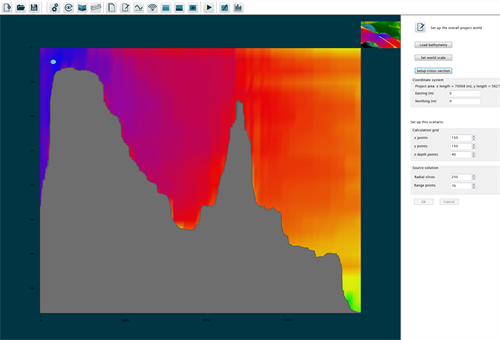
Noise levels are calculated throughout the entire project area and displayed in 3D. To examine results in more detail, levels may be plotted in cross sections or a detailed spectrum may be extracted at any point in the 3D calculation area.
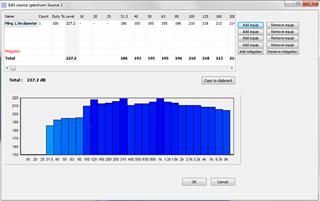
Levels are calculated in octave or third octave bands. Three different solvers are available and the user may choose different solvers for the low and high frequency ranges. Levels are compared to hearing thresholds of a number of common marine species or your own thresholds to give overall dBht levels.
Special Features
dBSea offers elegant ways to export calculation results. The user can generate a summary of the calculations for every point in the 3D calculation area. Results are produced in a format that is ready to be transferred to other software such as MS Excel or Word.
Graphical export is available to a range of formats (JPG, PNG, GIF, PDF, SHP, ESRI GRID). With the 3D graphics capabilities of dBSea, it is simple to create elegant report data showing sound levels, areas of interest and exclusion zones.
Videos
Below are some of videos available from our Youtube channel.
Also have a look at our blog that contains examples and stories related to dBSea.
Brief video walking through the steps of setting up a simple project in dBSea.
Brief video showing the modelling of moving sources such as seismic surveys.
Brief video introducing time series solves in dBSea.
dBSea Basic - free version of dBSea, also perfect as a viewer.
Using shapefiles and integrating with GIS.
Importing bathymetry.
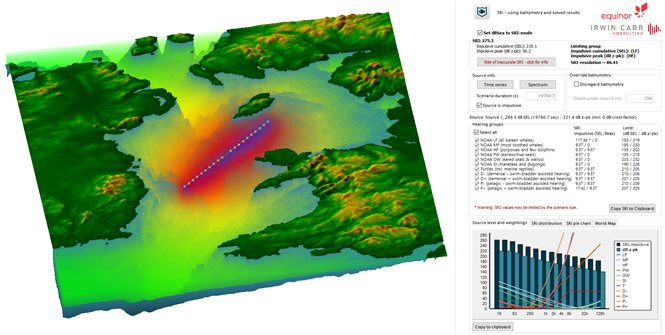
dBSea SRI tool
The Sound Risk Indicator Tool addresses the need for rapid assessment of design changes to noisy activities. It accounts for most marine fauna and presents the result as a single number, facilitating easy comparisons.
Developed by

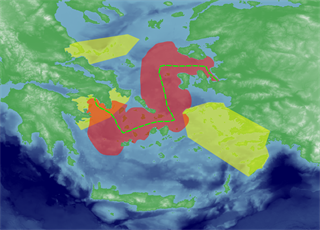
As sound propagation modelling in the marine environment in complex and often slow, with processing durations of several hours to days, Equinor and Irwin Carr have developed the SRI tool. This tool uses a conservative method to model the sound propagation and uses information about a noisy activity to predict if changes will result in increased or decreased impact on marine fauna. It accomplishes this in seconds to minutes and considers the frequency dependent vulnerability (weightings) of eleven animal groups that cover all marine mammals, most fishes and turtles for a total of 33 threshold values for both impulsive (Lpk and SEL) and continuous noise (SEL).
In this way, changes to a complex activity, with many moving sources, source levels and receivers, can quickly be evaluated for their effect on the environment. The SRI tool compresses everything into a single number that indicates the relative impact, while allowing the user to dig deeper into the data to discover where to change the design to most effectively mitigate impact.
The tool will accept information about the noisy activity either as band levels or as a timeseries, a common format from commercially available seismic array models and also the movement of the noise source(s). In absence of source data, the tool offers some models for generating source levels from large vessels and from seismic arrays.
The tool’s simple propagation modelling[1] provides the user with a good estimate of the highest possible impact. This means that if the tool predicts little to no impact, the user can be confident that further advanced modelling will similarly show little to no impact.
[1] Based on: “Duncan AJ, Parsons MJG. 2011. How Wrong Can You Be? Can a Simple Spreading Formula Be Used to Predict Worst-Case Underwater Sound Levels? Proceedings of Acoustics 2011, 87”